📝 产品详情
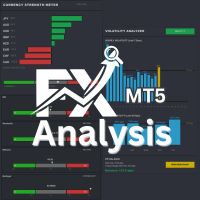
FX Analysis
| 作者 | Lee Teik Hong |
| 版本 | v6 |
| 更新 | 13 四月 2026 |
| 激活数 | 20 |
| 原价 | $299 USD |
FX Analysis is an all-in-one MT5 indicator dashboard that combines eight analytical tools in a single panel, helping traders identify high-probability setups without switching between charts or indicators.
Designed for standard forex pairs on MetaTrader 5. Best results on M15 - H4 timeframes when all components are used together as part of the included workflow.
Components
Volatility Analyzer
Displays historical average movement by hour and by day of the week. A real-time Pip Balance shows the remaining expected range for the current session. For example, if the daily average is 100 pips and price has moved 60 pips, the balance displays +40 pips — useful for setting realistic Take Profit targets.
Currency Strength Meter
Calculates relative strength across 28 major forex pairs and ranks all 8 base currencies from strongest to weakest. Green bars indicate strong currencies; red bars indicate weak ones. Use this to pair the strongest currency against the weakest for higher-confluence trade entries.
Oscillator Panel
Monitors RSI, Stochastic, Williams %R, Bollinger Bands, and Keltner Channels simultaneously. Each indicator casts a vote — Oversold, Neutral, or Overbought. A consensus of four or five indicators in agreement provides a stronger directional signal.
Top Picks Panel
Automatically scans all monitored symbols and surfaces pairs currently within 60–90% of their daily average range — the zone where price still has meaningful movement potential. Green buttons indicate a bullish bias; red buttons indicate bearish. Clicking any symbol loads its full analysis instantly.
Open New Chart
Available for any Top Picks symbol. Opens a dedicated chart window and plots a target line based on the remaining daily pip balance, giving a clear visual reference for potential price extension.
Pivot Points
Plots five classic pivot levels on a mini-chart. When price reaches 50% of its daily average range, a dotted MPV (Max-Point Volatility) line appears as an alert reference for potential reversals or continuations.
Bullish and Bearish Strength
Displays a real-time directional strength reading for the currently selected symbol, giving a quick snapshot of momentum bias at a glance.
Key Levels and Trade Summary
Automatically draws Entry, Stop Loss, and Take Profit levels directly on the chart based on current analysis. All lines are auto-generated and update dynamically as market conditions change.
Suggested workflow
1 Open the Top Picks panel and identify symbols in the 60–90% volatility range.
2 Select a symbol and review the Volatility Analyzer — confirm the pip balance is positive and the current hour is historically active.
3 Check the Currency Strength Meter — a wide gap between the two constituent currencies improves trade quality.
4 Review the Oscillator Panel — act when four or more indicators agree on a bullish or bearish condition.
5 Click Open New Chart to view the target level and place your trade.
This indicator is designed for use on MetaTrader 5 with standard forex pairs.
Past price data does not guarantee future movement. Always apply independent risk management before entering any trade.
安全须知
本产品仅通过 MQL5.com 官方渠道获取。其他渠道版本可能缺少完整功能和技术支持。
EA 配置
| 交易品种 | XAUUSD |
| 时间框架 | H1 (推荐) |
| 推荐经纪商 | IC Markets, IC Trading |
| 最低存款 | $300 / 0.01手 |
📸 截图预览