📝 产品详情
Exponential Moving Average
| 作者 | Tiago Azevedo Amorim Martins |
| 版本 | v1.0 |
| 激活数 | 0 |
Exponential Moving Average (EMA) Indicator
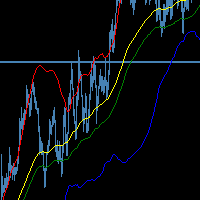
The Exponential Moving Average (EMA) is one of the most widely used indicators in technical analysis.
It smooths out price fluctuations to help traders identify market trends more clearly — without being too slow to react to price changes.
Unlike the Simple Moving Average (SMA), the EMA gives greater weight to recent prices, making it more responsive to new market information. This makes it ideal for traders who want to detect trend reversals earlier or confirm trend continuation with reduced lag.
How It Works
The EMA calculates an average of past prices, but applies an exponential weighting factor to give more importance to recent data.
When the price crosses above the EMA, it may signal a potential uptrend; when it crosses below, a downtrend could be forming.
This behavior allows traders to:
-
Identify trend direction
-
Spot potential entry and exit points
-
Use EMA as a dynamic support or resistance line
-
Combine it with other indicators (like RSI or MACD) for confirmation
Key Advantages
-
Faster response to recent price movements than SMA
-
Simple and effective tool for trend detection
-
Customizable for short-term or long-term trading
-
Works on any symbol or timeframe (Forex, Crypto, Stocks, Indices, etc.)
-
Perfect for building trading strategies and expert advisors (EAs)
Input Parameters
Ema Period: Number of bars used for the moving average calculation. (default: 50)
Applied Price: Price type used for calculation — Close, Open, High, Low, Median, Typical, or Weighted.
Line Color: Color of the Moving Average line displayed on the chart.
Line Width: Thickness of the Moving Average Line.
Line Style: Style of the EMA line (solid, dashed, dotted)
How to Use
-
Attach the indicator to any chart and timeframe.
-
Adjust the period according to your trading style:
-
Short-term traders → smaller periods (e.g., 10–20)
-
Long-term traders → larger periods (e.g., 50–200)
-
-
Combine with price action or other indicators for best results.
Tips
-
Combine multiple EMAs (e.g., EMA 50 and EMA 200) to identify trend crossovers.
-
Use it with an RSI filter to confirm overbought/oversold conditions.
-
EMA works best in trending markets, less so in sideways ranges.
安全须知
本产品仅通过 MQL5.com 官方渠道获取。其他渠道版本可能缺少完整功能和技术支持。
EA 配置
| 交易品种 | XAUUSD |
| 时间框架 | H1 (推荐) |
| 推荐经纪商 | IC Markets, IC Trading |
| 最低存款 | $300 / 0.01手 |
📸 截图预览