📝 产品详情
Horizontal lines by Aydmaxx
| 作者 | Shokhabbos Makhmudov |
| 版本 | v1.0 |
| 更新 | 2024-12-30T06:43:53 |
| 激活数 | 0 |
Description of the Horizontal Levels Indicator with Manual Interval Adjustment
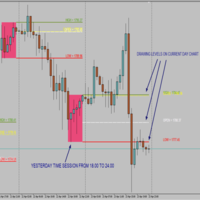
The indicator is designed for automatic plotting of horizontal levels on the chart of a financial instrument. It allows users to manually set the interval between levels, making it adaptable to various trading strategies and timeframes.
Key Features:
- Flexible Configuration: Users can define the interval between levels in points, percentages, or any other unit suitable for the selected asset.
- Automatic Plotting: The indicator automatically draws levels based on a starting point and the specified interval.
- Visualization: Levels are displayed with customizable colors and line thickness for easy identification on the chart.
- Multi-Timeframe Support: The indicator accurately displays levels regardless of the selected timeframe.
- Customization Options: Users can adjust the color, style, and number of displayed levels for a more tailored analysis experience.
Use Cases:
- Identifying key support and resistance levels.
- Analyzing market levels for planning entry and exit strategies.
- Supporting trading decisions based on areas of interest.
安全须知
本产品仅通过 MQL5.com 官方渠道获取。其他渠道版本可能缺少完整功能和技术支持。
EA 配置
| 交易品种 | XAUUSD |
| 时间框架 | H1 (推荐) |
| 推荐经纪商 | IC Markets, IC Trading |
| 最低存款 | $300 / 0.01手 |
📸 截图预览