📝 产品详情
Volume Profile Advance
| 作者 | Israr Hussain Shah |
| 版本 | v17 |
| 激活数 | 5 |
| 原价 | $40 USD |
Daily & Composite Volume Profile
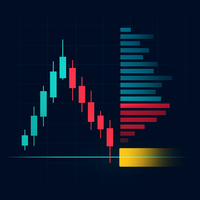
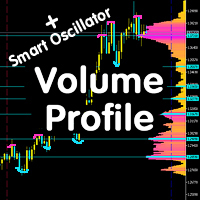
This is a professional-grade market profile tool designed for MetaTrader 5. It utilizes a Dual-Profile System to visualize supply, demand, and liquidity concentrations.
Key Features
-
Left Side: Daily Session Profiles
-
Automatically identifies the start and end of every trading day.
-
Generates a unique Volume Profile for each individual day.
-
Allows you to see how value migrated from yesterday to today (e.g., Is today's volume higher or lower than yesterday?).
-
-
Right Side: Composite Profile (Strategic View)
-
Aggregates volume data from the last days (default: 7 days).
-
Displays the "Big Picture" structure of the market.
-
Acts as a dynamic support/resistance map for the current week.
-
-
Value Area (VA) Logic
-
Calculates the specific price range where 70% (customizable) of the trading activity occurred.
-
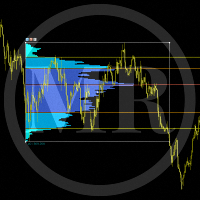
Blue Bars: represent the Value Area (High consensus).
-
Yellow Bars: represent the Outer Profile (Low consensus/Rejection zones).
-
-
Sentiment Visualization
-
The tips of the profile bars are split into Green (Bullish) and Red (Bearish) mini-bars to show who dominated that specific price level.
-
1. Visual Legend
-
Long Bars (Peaks): High Volume Nodes (HVN). These are areas where price spent a lot of time. They usually act as magnets (price likes to return here) or support/resistance.
-
Short Bars (Valleys): Low Volume Nodes (LVN). These are areas where price moved through quickly. The market rejected these prices. They often act as "gaps" that price tries to jump over.
-
Blue Zone: This is the "Fair Value" zone. The market is comfortable trading here. Expect choppy or ranging behavior inside the blue zone.
-
Yellow Zone: This is the "Unfair Value" zone. If price is here, it is likely overbought or oversold relative to that day's profile.
2. Key Levels (The Lines)
The indicator draws three lines extending from the profile. These are your primary trading levels:
-
Red Line (POC - Point of Control):
-
Definition: The single price level with the highest volume for the day/period.
-
How to read: This is the "Gravity Center." If price moves away from the POC, it often gets pulled back to it. It is the strongest Support/Resistance level.
-
Label: Marked as POC (Daily) or Avg POC (Composite).
-
-
Top Blue Line (VAH - Value Area High):
-
Definition: The highest price of the 70% value zone.
-
How to read: Resistance. If price breaks above this line and holds, it is a bullish breakout signal (price is seeking new value higher).
-
-
Bottom Blue Line (VAL - Value Area Low):
-
Definition: The lowest price of the 70% value zone.
-
How to read: Support. If price breaks below this line and holds, it is a bearish breakout signal.
-
3. Daily vs. Composite Analysis
This tool allows you to perform "Context vs. Timing" analysis:
-
Step 1: Look Right (The Composite Profile)
-
This tells you the major trend.
-
Example: If price is above the Composite POC, the weekly trend is generally bullish. Use the Composite VAH/VAL as major targets.
-
-
Step 2: Look Left (The Daily Profiles)
-
This tells you the immediate sentiment.
-
Example: Is today's POC higher than yesterday's POC? If yes, value is migrating upward (Bullish).
-
Example: Did price open outside of yesterday's Value Area? If yes, expect a volatile move (Initiative Buying/Selling).
-
安全须知
本产品仅通过 MQL5.com 官方渠道获取。其他渠道版本可能缺少完整功能和技术支持。
EA 配置
| 交易品种 | XAUUSD |
| 时间框架 | H1 (推荐) |
| 推荐经纪商 | IC Markets, IC Trading |
| 最低存款 | $300 / 0.01手 |
📸 截图预览