📝 产品详情
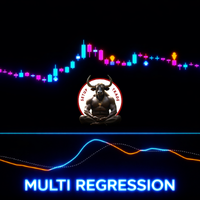
ST Multi Regression
| 作者 | Jean Carlos Souza |
| 版本 | v1.0 |
| 激活数 | 0 |
What is it?
It's a visual tool that helps identify good times to buy or sell in the financial market, based on colors and signals that appear on the chart.
How does it work?
Main Elements:
- Main Line (Oscillator)
- Blue (Aqua): Good time to buy
- Orange: Good time to sell
- Dotted Line (Silver)
- Serves as reference for signals
- Arrows
- ⬆️ Blue: Buy signal
- ⬇️ Orange: Sell signal
When to Trade?
?️ Buy Signals
- When the main line turns blue
- And crosses the dotted line from below
- A blue up arrow appears confirming
? Sell Signals
- When the main line turns orange
- And crosses the dotted line from above
- An orange down arrow appears confirming
Important Tips for Beginners:
- Start practicing with a demo account
- Don't trade using only this indicator
- Always use stop loss to protect your capital
- Observe the market for a few weeks before trading
- Study risk management before investing real money
Final Recommendations:
- Take notes of your results
- Start with small amounts
- Don't make impulsive decisions
- Always follow your trading plan
安全须知
本产品仅通过 MQL5.com 官方渠道获取。其他渠道版本可能缺少完整功能和技术支持。
EA 配置
| 交易品种 | XAUUSD |
| 时间框架 | H1 (推荐) |
| 推荐经纪商 | IC Markets, IC Trading |
| 最低存款 | $300 / 0.01手 |
📸 截图预览