📝 产品详情
RSI with Bollinger Bands
| 作者 | Aristeidis Gitas |
| 版本 | v1.1 |
| 更新 | 18 二月 2025 |
| 激活数 | 0 |
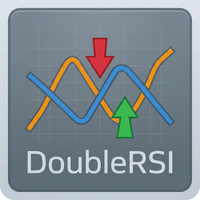
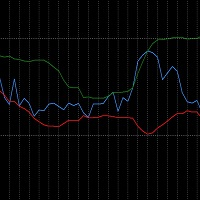
The RSI_BBands is a custom indicator designed to combine the Relative Strength Index (RSI) and Bollinger Bands (BB) for enhanced market analysis. It calculates the RSI using a specified period (default 14) and overlays Bollinger Bands around the RSI values, with adjustable parameters for the Bollinger Bands period and deviation.
You can find more free products HERE.
If you're looking for a low risk EA , check the Silent Pressure EA .
Key Features:
- RSI Calculation: The RSI is calculated based on price changes, with higher values indicating overbought conditions and lower values indicating oversold conditions.
- Bollinger Bands: The Bollinger Bands consist of three lines:
- Upper Band: Set to the mean RSI value plus the deviation multiplied by the standard deviation.
- Lower Band: Set to the mean RSI value minus the deviation multiplied by the standard deviation.
- Indicator Visualization: The indicator is drawn in a separate window, with the following visual elements:
- RSI Line (DodgerBlue): Represents the RSI values.
- Upper Band (Green): The upper boundary of the Bollinger Bands.
- Lower Band (Red): The lower boundary of the Bollinger Bands.
- Middle Band (Orange): The central line of the Bollinger Bands.
Parameters:
- RSI Period ( InpPeriodRSI ): Defines the period for calculating the RSI.
- Bollinger Bands Period ( BB_Period ): Specifies the period for the Bollinger Bands.
- Bollinger Bands Deviation ( BB_Deviation ): Determines the distance of the upper and lower Bollinger Bands from the mean RSI value.
Use Case:
This indicator is useful for traders who wish to analyze the RSI in relation to volatility and overbought/oversold conditions, with the added perspective of Bollinger Bands. It can provide signals based on price movements in relation to the RSI’s upper and lower boundaries, aiding in decision-making for market entries and exits.
安全须知
本产品仅通过 MQL5.com 官方渠道获取。其他渠道版本可能缺少完整功能和技术支持。
EA 配置
| 交易品种 | XAUUSD |
| 时间框架 | H1 (推荐) |
| 推荐经纪商 | IC Markets, IC Trading |
| 最低存款 | $300 / 0.01手 |
📸 截图预览