📝 产品详情
Price Trail Chart
| 作者 | Flavio Javier Jarabeck |
| 版本 | v1.1 |
| 更新 | 2020-04-17T20:08:31 |
| 激活数 | 0 |
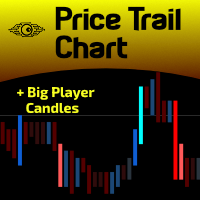
For those who hate candlesticks in lower timeframes (M1 through M15) we "invented" a clean new way to follow Price movement and displacement (volatility) called Price Trail Chart. The big "secret" is to get rid of those annoying candle wicks and draw the whole complete candle without them, this way we get a cleaner chart and a new view of the Price Path. No Open or Close markings, just LOW's and HIGH's, full body candle.
Additionaly we inserted a Volume monitor from our Best Downloaded indicator called Big Player Candles, painting with colors you choose the different volumes happening at each candlestick.
Give it a try, you may get surprised with a calm new way of looking at a Price Chart: just the Price Trail!
SETTINGS
- Ability to turn ON/OFF the Big Player Candles monitor.
- Volume Period (bars) to analyze.
- Volume Type to process: Real Volue / Tick Volume
- 5 colors for UP movement: Low, Medium, High and Ultra High.
- 5 colors for DOWN movement: Low, Medium, High and Ultra High.
As always, if you like this indicator, all I am asking is a little Review (not a Comment, but a REVIEW!)...
This will mean A LOT to me... And this way I can continue to give away Cool Stuff for Free...
With No Strings Attached! Ever!
Live Long and Prosper!
;)
安全须知
本产品仅通过 MQL5.com 官方渠道获取。其他渠道版本可能缺少完整功能和技术支持。
EA 配置
| 交易品种 | XAUUSD |
| 时间框架 | H1 (推荐) |
| 推荐经纪商 | IC Markets, IC Trading |
| 最低存款 | $300 / 0.01手 |
📸 截图预览