📝 产品详情
Explosion Signal Indicator
| 作者 | Sergei Ivashko |
| 版本 | v1.0 |
| 激活数 | 0 |
Explosion Signal Indicator analyzes the market for sharp changes in volatility and volume that often precede significant price movements. The indicator uses the ratio of short-term and long-term ATR to assess current volatility relative to the average level. Simultaneously, it monitors current volume compared to the average over a specified period.
When the volatility or volume exceeds the defined thresholds, the indicator determines the direction of movement through momentum calculation — the difference between the current closing price and the price N bars ago. The final signal is formed based on the combination of all three factors.
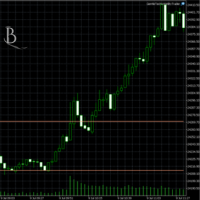
Results are displayed directly on the chart as color-coded candles: green indicates bullish momentum, red indicates bearish momentum, white marks transitional states, and gray shows no significant activity.
Key Features
• Volatility explosion detection through short/long ATR ratio
• Volume filtering with adjustable threshold
• Direction confirmation through momentum
• Signal visualization with colored candles on the main chart
• Interactive control panel with real-time parameter adjustments
• Debug mode with signal-to-signal performance visualization
• Statistics: signal count, win rate, total and average result in points
• Sound alerts and push notifications for new signals
• Settings preservation between sessions
Key Parameters
ATR Short Period — short ATR period for current volatility assessment (default 7)
ATR Long Period — long ATR period as baseline volatility level (default 21)
Volatility Threshold — ATR Short/Long ratio threshold for volatility explosion detection (default 1.2)
Volume Period — period for average volume calculation (default 20)
Volume Threshold — current to average volume ratio threshold (default 1.5)
Momentum Period — momentum calculation period for direction determination (default 10)
Max Debug Bars — analysis depth in bars for debug mode (default 3000)
Signal Interpretation
Green candle — volatility or volume explosion detected with positive momentum. Potential bullish signal.
Red candle — volatility or volume explosion detected with negative momentum. Potential bearish signal.
White candle — transitional state: explosion detected but momentum is uncertain, or previous signal is fading.
Gray candle — neutral state, no significant activity detected.
Trade Debug Mode
When Debug mode is enabled, the indicator visualizes the result of each signal: from the moment of appearance to the next opposite signal. The chart displays diagonal lines, horizontal result lines, and labels showing the number of points. The panel shows overall statistics: win rate, number of profitable and losing trades, total and average result.
Additional Information
The indicator works on any symbol and timeframe. Sufficient history is required for proper operation (minimum 100 bars). All parameters can be adjusted through the control panel directly on the chart — changes are applied instantly without restarting the indicator.
It is recommended to use the indicator as an entry filter in combination with other analysis methods. A colored signal indicates increased market activity but does not guarantee continuation in the indicated direction.
安全须知
本产品仅通过 MQL5.com 官方渠道获取。其他渠道版本可能缺少完整功能和技术支持。
EA 配置
| 交易品种 | XAUUSD |
| 时间框架 | H1 (推荐) |
| 推荐经纪商 | IC Markets, IC Trading |
| 最低存款 | $300 / 0.01手 |
📸 截图预览