📝 产品详情
Matrix Series Trends
| 作者 | Sathya Prasath R |
| 版本 | v1.2 |
| 更新 | 2025-02-20T06:43:46 |
| 激活数 | 0 |
Key features of the Matrix Series indicator:
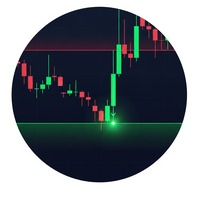
- Dynamic Zones:Calculates support and resistance levels based on CCI values, allowing users to adjust the sensitivity of these zones through customizable parameters like "SupResPeriod" and "SupResPercentage".
- Visual Candlestick Representation:Displays candlesticks with colors that indicate the current trend direction, helping to visually identify potential trend changes.
- Overbought/Oversold Signals:Plots circles or other visual markers on the chart when price reaches extreme levels (overbought or oversold), providing potential entry/exit points.
Customizable Smoothing:
Users can adjust the smoothing applied to the indicator (often using an EMA) to fine-tune its responsiveness to price movements.
How to use the Matrix Series indicator:
- Identify Potential Reversals:Look for areas where the price reaches extreme levels within the overbought/oversold zones, as indicated by the indicator's signals.
Confirm Trend Direction:
- Use the color of the candlesticks generated by the Matrix Series to confirm the overall trend direction.
Important considerations:
- Customization is key:Adjust the parameters of the Matrix Series to suit your trading style and market conditions.
Disclaimer:
- This Indicator is a tool to assist in your trading decisions and does not guarantee profits.
- Always backtest the indicator in conjunction with other technical analysis techniques and fundamental analysis before making trading decisions.
安全须知
本产品仅通过 MQL5.com 官方渠道获取。其他渠道版本可能缺少完整功能和技术支持。
EA 配置
| 交易品种 | XAUUSD |
| 时间框架 | H1 (推荐) |
| 推荐经纪商 | IC Markets, IC Trading |
| 最低存款 | $300 / 0.01手 |
📸 截图预览