📝 产品详情
Aklamavo Dom Ladder
| 作者 | Sylvester Aklamavo |
| 版本 | v22 |
| 更新 | 25 一月 2026 |
| 激活数 | 5 |
| 原价 | $50 USD |
This is a Market Depth (DOM - Depth of Market) Indicator for MetaTrader 5 that displays real-time order book data in a visual ladder format.
The DOM provides a comprehensive view of market depth with clear visual cues for volume imbalances, making it useful for both scalping and swing trading decisions
This indicator provides traders with a professional-grade market depth visualization that can be customized to match individual trading preferences and strategies. You can easily switch between traditional coloring (green for bids, red for asks) and swapped coloring (red for bids, green for asks)
-
Real-time Market Depth: Displays bid and ask orders from the market book in a ladder format
-
Visual Volume Representation: Shows order volumes as horizontal bars with color-coded intensity
-
Price Ladder: Central column displays price levels in proper ascending/descending order
1. Basic Layout
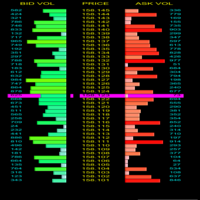
The DOM displays three columns:
-
Left Column: Bid Volume Ladder (using red color gradient)
-
Middle Column: Price Levels
-
Right Column: Ask Volume Ladder (using green color gradient)
2. Volume Display Options
Two modes for volume totals at the bottom:
Mode 1: Default (Total All Volumes)
-
Bid Column Bottom: Shows "Total: [number]" - sum of ALL bid volumes
-
Ask Column Bottom: Shows "Total: [number]" - sum of ALL ask volumes
-
Price Column Bottom: Shows "Δ: [±number]" - delta = (ALL Ask volumes) - (ALL Bid volumes)
Mode 2: Relative to Current Price
-
Bid Column Bottom: Shows "Bid Below: [number]" - sum of ONLY bid volumes BELOW current price
-
Ask Column Bottom: Shows "Ask Above: [number]" - sum of ONLY ask volumes ABOVE current price
-
Price Column Bottom: Shows "Δ: [±number]" - delta = (Ask volumes ABOVE) - (Bid volumes BELOW)
3. Delta Calculation & Color Coding
-
Delta Formula: ALWAYS = ASK - BID (for both modes)
-
Positive Delta (Green): More Ask volume than Bid volume (ASK > BID)
-
Negative Delta (Red): More Bid volume than Ask volume (BID > ASK)
4. Visual Features
-
Color Gradient: Each ladder uses 3-color interpolation (light to dark) based on volume ranking
-
Current Price Highlight: Magenta highlight bar across all three columns at current price level
-
Text Color Change: Current price row has black text for better visibility
-
Headers: Each column has a header showing volume type (Tick/Real)
-
Separator Lines: Gray vertical lines between columns
5. Customization Options
Input Parameters:
-
Display position (Left/Right side of chart)
-
Volume type (Tick volume or Real volume accumulation)
-
Total display mode (All volumes or Relative to price)
-
Number of rows to display (default 45)
-
Color schemes for both ladders (3-color gradients each)
-
Font sizes and colors for all text elements
-
Rectangle dimensions
-
Highlight colors
6. Functional Features
-
Real-time Updates: Updates with market book events
-
Dynamic Highlighting: Current price highlight follows market price
-
Resize Handling: Adjusts to chart size changes
-
Position Switching: Can display on left or right side of chart
-
Volume Calculation: Supports both tick volume and accumulated real volume
-
Price-based Filtering: In relative mode, only counts volumes above/below current price
7. Display Logic
-
Bid Ladder: Uses ASK colors (red gradient) - higher volume = darker red
-
Ask Ladder: Uses BID colors (green gradient) - higher volume = darker green
-
Price Column: Shows price levels, current price row has black text
-
Volume Bars: Width represents relative volume (wider = higher volume)
-
Volume Text: Shows actual volume numbers aligned to edges of columns
8. Use Case Examples
For Order Flow Analysis:
-
Use "Relative to Price" mode to see immediate pressure above/below current price
-
Green delta = Ask pressure (potential resistance)
-
Red delta = Bid pressure (potential support)
For Overall Market Depth:
-
Use "All Volumes" mode to see total market interest
-
Compare total bid vs ask volumes for overall bias
For Entry/Exit Decisions:
-
Watch delta color changes at key price levels
-
Monitor how volumes above/below current price change as price moves
1. The DOM Psychology
When BID volume > ASK volume (Negative Δ):
-
Aggressive sellers are hitting the bids
-
Buyers are passive - sitting on bids waiting
-
Sellers are impatient - taking whatever price buyers offer
-
Result: Price gets PUSHED DOWN as sellers hit lower and lower bids
When ASK volume > BID volume (Positive Δ):
-
Aggressive buyers are lifting the asks
-
Sellers are passive - sitting on asks waiting
-
Buyers are impatient - paying whatever price sellers ask
-
Result: Price gets PUSHED UP as buyers lift higher and higher asks
2. The Market Microstructure Truth
Thick side = Liquidity = Target for aggressive traders
-
If BID side is thick: Sellers will target it (price goes DOWN)
-
If ASK side is thick: Buyers will target it (price goes UP)
Your Δ = ASK - BID shows:
-
Negative Δ = Thick bid side = Sellers target it = Price DOWN
-
Positive Δ = Thick ask side = Buyers target it = Price UP
3. This Matches Professional Trading Concepts
Absorption vs. Rejection:
-
Negative Δ + Price DOWN: Bids being absorbed (bearish)
-
Positive Δ + Price UP: Asks being absorbed (bullish)
Liquidity Grabs:
-
Price spikes through thin side to hit thick side
-
Your Δ shows which side is thick (target for moves)
4. Trading Implications
When Δ is NEGATIVE (BID > ASK):
-
Watch for: Price dropping through bids
-
Trade: Short opportunities
-
Stop: Above current level
-
Target: Next bid clusters below
When Δ is POSITIVE (ASK > BID):
-
Watch for: Price rising through asks
-
Trade: Long opportunities
-
Stop: Below current level
-
Target: Next ask clusters above
5. Why This Makes Perfect Sense
Think of it as "Where's the meat?":
-
Negative Δ: Meat (liquidity) is on BID side = Bears attack it
-
Positive Δ: Meat (liquidity) is on ASK side = Bulls attack it
Price follows liquidity - moves toward thick side to fill orders.
6. Confirmation with Price Action
Strong Signal:
-
Δ negative + Price breaking down = Strong bearish
-
Δ positive + Price breaking up = Strong bullish
安全须知
本产品仅通过 MQL5.com 官方渠道获取。其他渠道版本可能缺少完整功能和技术支持。
EA 配置
| 交易品种 | XAUUSD |
| 时间框架 | H1 (推荐) |
| 推荐经纪商 | IC Markets, IC Trading |
| 最低存款 | $300 / 0.01手 |
📸 截图预览