📝 产品详情
DFG Chart
| 作者 | Tsvetan Tsvetanov |
| 版本 | v1.0 |
| 激活数 | 0 |
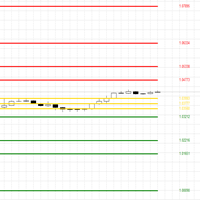
The DFG Chart Indicator displays the historical DFG levels used in the DFG dashboard. These levels are generated dynamically using moving averages and Fibonacci ratios. The Fibonacci Bands automatically adjust to reflect changes in the price range and trend direction. The indicator also features buttons for selecting chart symbol and timeframe, along with a wide range of customization options.
Key Features
-
Dynamic DFG Levels
Automatically calculated using moving averages and Fibonacci ratios. -
Historical Level Visualization
Displays the history of DFG levels as shown in the DFG dashboard. -
Adaptive Fibonacci Bands
Fibonacci bands adjust automatically based on changes in the price range and trend direction. -
Symbol & Timeframe Selector
Built-in buttons allow quick switching between chart symbols and timeframes. -
Customization Options
Numerous settings for tailoring the indicator’s appearance. The settings and color themes of DFG Chart match those of the DFG Dashboard.
安全须知
本产品仅通过 MQL5.com 官方渠道获取。其他渠道版本可能缺少完整功能和技术支持。
EA 配置
| 交易品种 | XAUUSD |
| 时间框架 | H1 (推荐) |
| 推荐经纪商 | IC Markets, IC Trading |
| 最低存款 | $300 / 0.01手 |
📸 截图预览