📝 产品详情
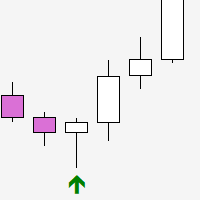
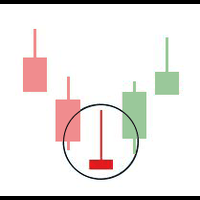
Engulfing bar after trend change
| 作者 | paultraderone |
| 版本 | v1.1 |
| 更新 | 25 一月 2023 |
| 激活数 | 0 |
-
The EMA Engulfing Cross indicator is an indicator for the MetaTrader 5 platform that signals potential buy and sell opportunities based on an engulfing candle pattern after a recent exponential moving average cross.
-
You can adjust how recently the trend change must have occurred using the PASTemaCROSS input.
-
The RSI oversold/overbought function is used to confirm the signals generated by the moving averages. It takes into account the previous bar before the engulfing bar, and it is best used with RSI periods between 4-8 and very low or high level values.
-
The indicator plots two lines on the chart as signal alerts, making it easy to identify potential buy and sell opportunities. The orange line represents a "Buy" signal and the blue line represents a "Sell" signal.
-
The indicator uses two moving averages (EMA1 and EMA2) to identify potential buy and sell signals.
-
The indicator has several input parameters that can be adjusted, including the periods for the moving averages (EMA1, EMA2), the RSI period, and the RSI upper and lower levels.
As standard inputs are set please add to your chart
30 period ema
100 period ema
rsi period 5
levels 30/70
ALL VARIABLE.
THANKYOU AND STAY TUNED
安全须知
本产品仅通过 MQL5.com 官方渠道获取。其他渠道版本可能缺少完整功能和技术支持。
EA 配置
| 交易品种 | XAUUSD |
| 时间框架 | H1 (推荐) |
| 推荐经纪商 | IC Markets, IC Trading |
| 最低存款 | $300 / 0.01手 |
📸 截图预览