📝 产品详情
Candle Retracements
| 作者 | Flavio Javier Jarabeck |
| 版本 | v1.4 |
| 更新 | 2020-04-30T13:38:34 |
| 激活数 | 0 |
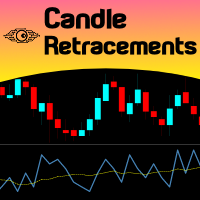
Do you want to know how much, how frequent and at what level a candlestick retraces over the previous one, just drop Candles Retracement over your chart and see it visually! Just choose your desired timeframe and the indicator will show it graphically. As simple as that... In addition you have the option to calibrate a Moving Average over this sub-window chart monitor. This indicator could be used to study candle retracements levels so you can comfortably expect during a trade what to expect from Price.
The measuring mechanism is simple:
SETTINGS
- Moving Average period to apply
If you like this indicator, all I am asking is a little Review (not a Comment, but a REVIEW!)...
This will mean A LOT to me... And this way I can continue to give away Cool Stuff for Free...
With No Strings Attached! Ever!
Live Long and Prosper!
;)
安全须知
本产品仅通过 MQL5.com 官方渠道获取。其他渠道版本可能缺少完整功能和技术支持。
EA 配置
| 交易品种 | XAUUSD |
| 时间框架 | H1 (推荐) |
| 推荐经纪商 | IC Markets, IC Trading |
| 最低存款 | $300 / 0.01手 |
📸 截图预览