📝 产品详情
Sabsim Tech Analysis Tool
| 作者 | Christoph Kreher |
| 版本 | v1.2 |
| 更新 | 3 十月 2023 |
| 激活数 | 5 |
This tool helps to get a quick overview of a market.
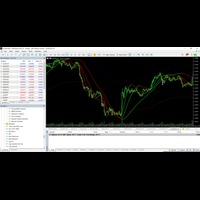
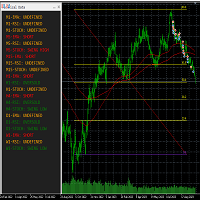
In one panel, indicators show trend, swing highs/lows and overbought/oversold information of various time frames (M1,M5,M15,H1,H4,D1,W1).
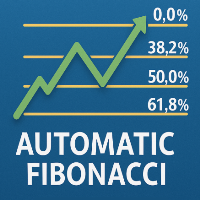
Fibonacci can be used to identify different price levels. The input parameters of all indicators can be set by the user.
The time frames can be changed as desired. The user can decide for himself which indicators he would like to see in the panel.
Fibonacci appears on the chart at the next minute change at the latest. So don'tworry if it does not appear immediately.
安全须知
本产品仅通过 MQL5.com 官方渠道获取。其他渠道版本可能缺少完整功能和技术支持。
EA 配置
| 交易品种 | XAUUSD |
| 时间框架 | H1 (推荐) |
| 推荐经纪商 | IC Markets, IC Trading |
| 最低存款 | $300 / 0.01手 |
📸 截图预览