📝 产品详情
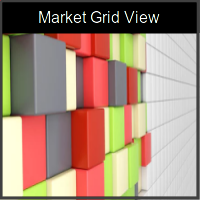
Market Grid View
| 作者 | Danilo Pagano |
| 版本 | v1.0 |
| 更新 | 2018-06-19T14:44:41 |
| 激活数 | 78603 |
Market Grid View is a utility to replace the original 'Market Watch' window. It was designed to be fast and give the user the ability to navigate over all symbols with just a click, while watch the price change or last trade value.
To use it, configure your "Market Watch" window with all the symbols you want to monitor, and you can close it. Then insert the indicator in the graph.
The parameters window need to be configured:
- Columns: the number of columns you want to be drawn
- ShowInfo: the type of information you want to show
- last trade value in the same currency as the symbol
- price change from close
- price change from last trade in last session
- price change from open
The price change from close is:
- 100*(last - close)/close
- The close is the last value trade in the last day. It is very common to measure the price change with this method.
The price change from last trade in last session is:
- 100*(last - last_session_trade)/last_session_trade
The price change from open is:
- 100*(last - open)/open
- This is very useful for daytraders that do not stay with positions overnight.
After the Market Grid View is inserted, all symbols will be shown in a grid.
The background color for each symbol box always uses the same "ShowInfo" configuration to estimate the color. When the price change is 10% or bigger, the maximum color will be set (green or red), otherwise, a proportional color will be set.
Even when using the LAST in the show info field, the background is still configured based on price change from last trade from last session.
If you click inside a symbol box, the chart will be configured with the symbol you clicked in.
There is a limitation of 200 symbols, because in the computer I used to test, I have memory limitations, so I could not test with more then 200 symbols. If you need more than that, please email me.
I only validate it in Brasilian Stock Market (BOVESPA) and XM Forex trading.
HEATMAP Functionality
You can use this tool as a heatmap. If you configure the symbols to be close in the list, than it will became a heatmap. Suppose you want to follow all stocks that are related to Oil, then you group close all the symbols related to Oil, and it will serve as a heatmap.
For example, you want to check the Australian Stock Market. Then select only symbols from Australia from Symbols window (ctrl+M), and you have a HeatMap for Australia. Check the print bellow.
Or, suppose you want to figure out which section from Bovespa is having the better performance today. Order your Symbols in market watch (ctrl+M) and them will be separated by sections. For example, in the 2 firsts lines of the screenshot for iBovespa, we can see how the banks are performing at this moment. Check the other print bellow.
安全须知
本产品仅通过 MQL5.com 官方渠道获取。其他渠道版本可能缺少完整功能和技术支持。
EA 配置
| 交易品种 | XAUUSD |
| 时间框架 | H1 (推荐) |
| 推荐经纪商 | IC Markets, IC Trading |
| 最低存款 | $300 / 0.01手 |
📸 截图预览