📝 产品详情
V Pattern Support and Resistance Scanner
| 作者 | Deyna Kurniawan |
| 版本 | v1.0 |
| 激活数 | 5 |
V-Pattern Support & Resistance Scanner
V-Pattern Support & Resistance Scanner is a powerful market structure indicator for MetaTrader 5 designed to automatically detect high-probability Support and Resistance levels based on true V-Pattern price reversals.
Unlike traditional support resistance indicators that simply mark random highs and lows, this indicator identifies real structural turning points where the market forms a confirmed V-shaped reversal and where the level remains valid because price has never closed beyond it afterward.
This approach produces cleaner, stronger, and more reliable trading levels, helping traders focus only on institutional reaction zones that truly matter.
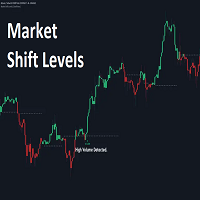
The indicator automatically scans multiple timeframes and displays the nearest and most relevant Support and Resistance levels directly on your chart, allowing traders to quickly identify important trading areas without cluttering the chart.
It is ideal for price action traders, Smart Money Concepts traders, supply & demand traders, scalpers, and swing traders who rely on accurate market structure.
Why V-Pattern Levels Are PowerfulFinancial markets frequently create sharp V-shaped reversals when large institutional orders enter the market.
These areas often become key trading zones such as:
• strong Support levels
• strong Resistance levels
• institutional reaction zones
• liquidity areas where price reacts again
The V-Pattern Support & Resistance Scanner automatically detects these structures by analyzing:
• left-side price momentum before the reversal
• right-side confirmation candles after the turning point
• price behavior to ensure the level remains unbroken
Only levels that remain structurally valid are displayed.
This eliminates weak or already broken zones and leaves only high-quality support resistance levels on your chart.
Automatic V-Pattern DetectionThe indicator uses a structured confirmation logic to identify true V-shaped market reversals.
A level becomes valid only when:
• the left candles confirm a strong directional move
• the right candles confirm the reversal structure
• price has not closed through the level afterward
This process filters out noise and ensures that only clean structural levels are displayed.
Multi-Timeframe Support & Resistance ScannerOne of the most powerful features of this indicator is its multi-timeframe scanning capability.
The indicator can analyze two different timeframes simultaneously, allowing traders to combine higher timeframe structure with lower timeframe execution.
Example combinations used by professional traders:
• H4 + H1
• H1 + M15
• D1 + H4
Each timeframe is displayed with different colors and line styles so traders can easily distinguish between them.
This helps traders see the bigger market structure while trading lower timeframe setups.
Smart Level FilteringMost support resistance indicators fill the chart with too many lines.
This indicator intelligently filters levels so traders only see what is relevant.
Displayed levels include:
• Resistance levels above current price
• Support levels below current price
This keeps the chart clean, focused, and easy to analyze.
Nearest High-Probability LevelsInstead of drawing dozens of unnecessary levels, the indicator automatically selects the Top 5 nearest Support and Resistance levels for each timeframe.
This approach highlights the most important price zones where the market is most likely to react.
The result is a chart that remains clear and highly readable while still showing critical trading information.
Origin-Based Level VisualizationEvery detected support or resistance level begins exactly at the candle where the V-Pattern structure formed.
This allows traders to clearly see:
• the origin of the level
• how price reacted after formation
• how long the level has remained respected by the market
This visualization helps traders understand true market structure behavior.
Infinite Forward ProjectionAll detected levels automatically extend to the right side of the chart.
This allows traders to observe how price interacts with these levels in real time as the market develops.
These projections make the indicator extremely useful for:
• entry planning
• breakout confirmation
• reaction trading
The indicator includes customizable inputs so traders can adapt it to different strategies.
Users can configure:
• Timeframe 1
• Timeframe 2
• Support color
• Resistance color
• Line style
• Line thickness
• V-pattern confirmation bars (left / right)
• Maximum scan depth
These options allow traders to control the sensitivity and appearance of the indicator.
Ideal For Many Trading StrategiesThe V-Pattern Support & Resistance Scanner can be used in a wide range of trading approaches:
• Price Action Trading
• Supply & Demand Trading
• Smart Money Concepts (SMC)
• Breakout Trading
• Reversal Trading
• Scalping
• Intraday Trading
• Swing Trading
It is especially useful for traders who focus on market structure and liquidity behavior.
Practical Trading ApplicationsTraders often use the detected levels to:
• identify high-probability entry zones
• locate take profit targets
• define stop loss placement
• confirm breakout opportunities
• detect liquidity reaction areas
Because these levels are derived from confirmed price structure, they are highly relevant for real trading decisions.
Advantages Over Traditional Support Resistance IndicatorsMost indicators simply draw levels based on highs and lows.
V-Pattern Support & Resistance Scanner goes much deeper.
It:
✔ detects true structural market reversals
✔ ignores already broken levels
✔ filters irrelevant price zones
✔ supports multi-timeframe analysis
✔ highlights the nearest high-probability levels
✔ keeps the chart clean and professional
The indicator works on all trading instruments available in MetaTrader 5 including:
• Forex currency pairs
• Gold (XAUUSD)
• Indices
• Cryptocurrencies
• Commodities
• Stocks
It supports all timeframes from M1 to Monthly.
Recommended Timeframe CombinationsFor optimal results many traders use combinations such as:
• H4 + H1 for swing trading
• H1 + M15 for intraday trading
• M15 + M5 for scalping
This allows traders to combine higher timeframe structure with lower timeframe entries.
Quick Installation- Install the indicator in MetaTrader 5
- Attach it to any chart
- Select the desired timeframes
- Start trading using automatically detected Support and Resistance V-Pattern levels
support resistance indicator MT5
multi timeframe support resistance
price action indicator
supply and demand indicator
V pattern indicator
reversal indicator MT5
smart money concept indicator
support resistance scanner
price level indicator
forex support resistance MT5
安全须知
本产品仅通过 MQL5.com 官方渠道获取。其他渠道版本可能缺少完整功能和技术支持。
EA 配置
| 交易品种 | XAUUSD |
| 时间框架 | H1 (推荐) |
| 推荐经纪商 | IC Markets, IC Trading |
| 最低存款 | $300 / 0.01手 |
📸 截图预览