📝 产品详情
DrillDown Timeframe
| 作者 | Wael Tahar |
| 版本 | v1.0 |
| 激活数 | 5 |
| 原价 | $100 USD |
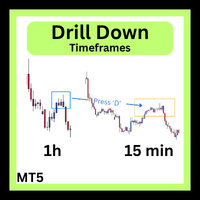
DrillDown Timeframe is a MetaTrader 5 utility that enables seamless navigation between higher and lower timeframes with visual area highlighting. Draw a rectangle on any timeframe and instantly drill down to see the same price region on a lower timeframe.
How it works:
- Set the Higher and Lower Timeframes in the indicator's variables (Example 1h / 15min)
- On the selected higher timeframe, press 'B' to create a draggable/resizable rectangle (Blue) in the visible chart area.
- Select (double click on the rectangle to select) and drag the rectangle to the required area
- Press 'D' to switch to the lower timeframe
- Press 'D' again (or click on 'Go to Region' button on the lower timeframe) to go to the same price region that is highlighted with an orange rectangle.
- Press 'R' to return to the higher timeframe. The rectangle can be moved and resized before drilling down.
- Press 'T' to toggle visibility of the rectangle (whether in the higher or lower timeframe)
- In the higher Timeframe, if you scroll back in history, just press 'B' to reset/display the Blue rectangle in the current area.
Key Features:
- Visual area selection - Draw a customizable rectangle on higher timeframe to mark your region of interest
- Automatic timeframe switching - Press 'D' to instantly switch from higher to lower timeframe
- Price-accurate highlighting - The orange rectangle on lower timeframe shows the exact same price area from the higher timeframe
- Draggable and resizable - Adjust the rectangle position and size before drilling down
- Navigation button - Click "Go to Region" button on lower timeframe to scroll directly to the highlighted area
- Toggle visibility - Press 'T' to show or hide the rectangles on both timeframes
- Persistent settings - Rectangle position and settings persist when switching between timeframes
- Configurable timeframes - Choose any combination of higher and lower timeframes
Keyboard Shortcuts:
- B - Create/Reposition rectangle on higher timeframe
- D - Drill down to lower timeframe (from HTF) / Go to highlighted region (on LTF)
- R - Return to higher timeframe
- T - Toggle rectangle visibility
Use Cases:
- Analyze price action on lower timeframes within a specific higher timeframe zone
- Quickly navigate between swing areas across multiple timeframes
- Mark support/resistance zones on higher timeframe and examine them in detail on lower timeframe
Input Variables Description
- HigherTF - The higher timeframe (drop down list) where the blue selection rectangle is created. This is the starting timeframe for analysis. Default is M15.
- LowerTF - The lower timeframe (drop down list) to drill down into. The orange highlight rectangle appears here showing the same price region. Default is M3.
- RectColor - Color of the selection rectangle on the higher timeframe. Choose any color for better visibility on your chart theme. Default is DodgerBlue.
- ButtonCorner - Screen corner position for the "Go to Region" navigation button on the lower timeframe. Options: upper left, upper right, lower left, lower right. Default is lower left.
安全须知
本产品仅通过 MQL5.com 官方渠道获取。其他渠道版本可能缺少完整功能和技术支持。
EA 配置
| 交易品种 | XAUUSD |
| 时间框架 | H1 (推荐) |
| 推荐经纪商 | IC Markets, IC Trading |
| 最低存款 | $300 / 0.01手 |
📸 截图预览