📝 产品详情
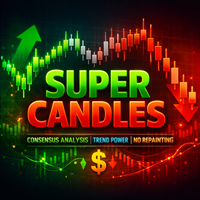
Super Candles
| 作者 | Pieter Gerhardus Van Zyl |
| 版本 | v2 |
| 激活数 | 5 |
| 原价 | $40 USD |
Check out my German Pro Signal - https://www.mql5.com/en/signals/2354346
Super Candles is a powerful visual trading indicator designed to transform ordinary price candles into a clearer representation of market sentiment. Instead of relying on a single technical signal, the indicator evaluates multiple market factors and combines them into a unified “consensus score.” This score is then displayed directly on the chart using color-coded candles, allowing traders to quickly recognize shifts in bullish or bearish momentum.
Each candle represents the strength of market pressure during that period. A gradient color system highlights different levels of sentiment, ranging from strong bullish conditions to strong bearish conditions, with neutral zones indicating balanced or indecisive markets. This approach helps reduce chart clutter while providing a fast visual interpretation of underlying market behavior.
The indicator also supports optional multi-timeframe analysis. By incorporating information from higher timeframes, Super Candles can reflect broader market context while still being displayed on the current chart. This allows traders to see whether short-term price movement aligns with larger trends.
Important: When higher timeframe options are enabled, the indicator may repaint while those higher timeframe candles are still forming. This is normal behavior when referencing unfinished higher timeframe data. Once the higher timeframe bar closes, the values stabilize. However, when both timeframe options are set to the current timeframe (which is the default setting), the indicator does not repaint because it only relies on completed data from the active chart.
How to Use
Traders typically use Super Candles to identify trend strength and potential continuation zones. Strong bullish colors suggest dominant buying pressure, while strong bearish colors indicate selling pressure. Neutral or mixed colors can signal consolidation or possible transitions in market direction.
Many traders use the indicator as a confirmation tool alongside price action, support and resistance, or breakout strategies. For example, trading in the direction of strong candle colors during trending markets can help align entries with prevailing momentum. It can also be useful for filtering trades, avoiding positions when market sentiment appears weak or conflicting.
Because the indicator focuses on visual clarity and consensus analysis, it helps traders quickly interpret complex market conditions without exposing the internal calculation methods behind its signals.
安全须知
本产品仅通过 MQL5.com 官方渠道获取。其他渠道版本可能缺少完整功能和技术支持。
EA 配置
| 交易品种 | XAUUSD |
| 时间框架 | H1 (推荐) |
| 推荐经纪商 | IC Markets, IC Trading |
| 最低存款 | $300 / 0.01手 |
📸 截图预览